A short while ago I attended a SpringerNature Webinar on How does the proliferation of new researcher tools affect libraries and publishers? One of the three presentations particularly caught my attention and I’ve written up a summary and some of my own thoughts here. The presenters were Bianca Kramer & Jeroen Bosman, Subject Librarians at Utrecht University.
Bianca and Jeroen presented results from a global survey of researchers they conducted in 2015-16. It was a large survey with over 20,0000 participants and versions in various different languages. The survey asked participants about what tools they used for different parts of their research workflow, and language specific tools were included in the non-English versions of the survey. Bianca made the point that with the aid of modern technologies, the research workflow does not have to be, and often is not, linear.
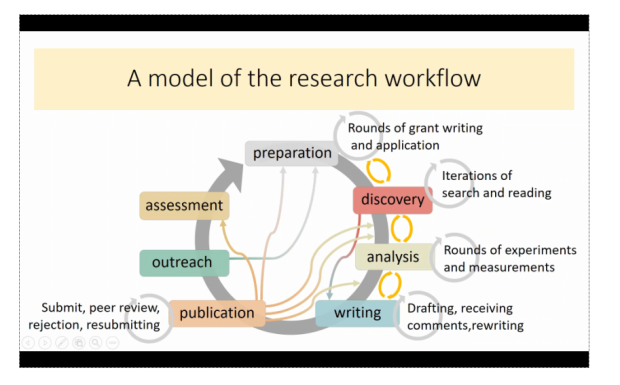
showing the non-linear research workflow.
The results of the survey are all openly available on the project’s website –
101innovations.wordpress.com. Most of the results Bianca and Jeroen presented were not a surprise to me, but there was one thing that jumped out – the high proportion of respondents sharing their research on ResearchGate (64%), particularly in comparison with those using institutional repositories (36%). I downloaded the Excel data available from the WordPress site, and when I just looked at the UK data for this question, it was far more what I was expecting – 47% for ReasearchGate and 48% for institutional repositories – reminding me to expect global variation.
They had also looked at the links between different tools and had mapped out how many respondents using a particular tool for one activity used the various tools for another activity. Jeroen talked about librarians supporting the integration of the different tools, which resonated with me. When talking to my library users about tools or demonstrating them, the question of whether and how they integrate with other tools or software often comes up.
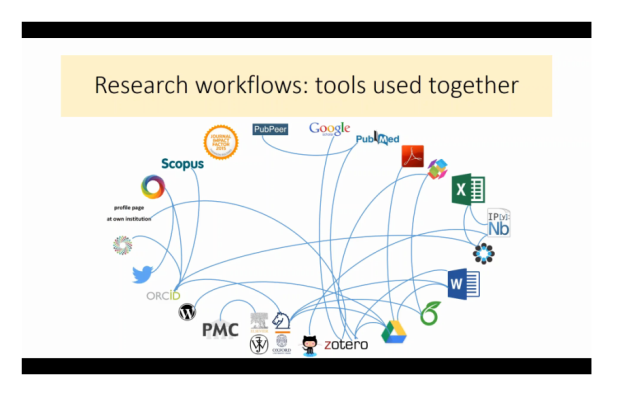
The heat maps produced to show the frequency of different tools being used together are
available online and I’m wondering whether I could use them to help in my decisions of which tools to focus my user education resources on. I have a very long list of things I could produce resources on, and deciding which is most important is not easy. For example, if I know Google Scholar, Mendeley, R and Microsoft Word are popular with my users – what other tools do people often use with these? Do these linkages reflect ease or possibility of integration? Similarity in type/style of interface? Or do they depend more on which tools are pushed by individuals or institutions?
Although it’s obvious a lot of work has gone into this project, it had only a small amount of external fundraising. The project started from personal interest, and was mainly supported by Utrecht University providing time to work on project.
